
Groups of individuals such as investors, managers, and senior executives who have a need to see regular reports to get a birds-eye perspective on performance.
To reflect progressive changes, demonstrating the status quo, assessing performance, providing clarity and transparency.
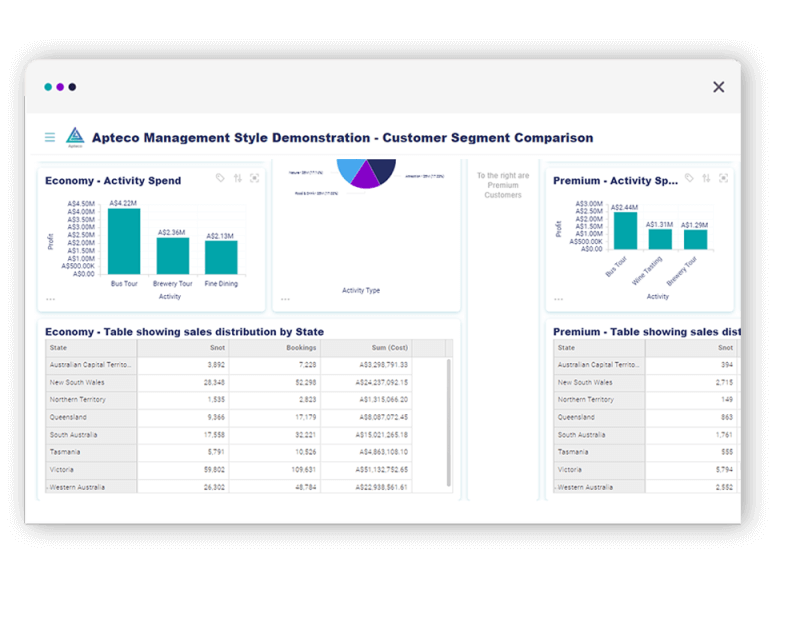
This dashboard is comprised of several tiles depicting an underlying dataset in the form of graphs and charts focusing on, for example, a particular product line, store, or time-period.
Combine tables and charts to give you the full picture
Apteco Orbit allows you to combine tables and charts on your dashboards, allowing the viewer to get a clearer picture of the data story. Tables allow you to deep dive precisely into the details and examine the exact numbers behind the visualisations
A variety of chart types and visualisations to explore your data
Choose from a variety of interactive visualisations, including bar and line, stacked and column, pie and donut, radar and area charts, Venn diagrams, text tiles, maps and more to ensure that you get a clear view of your data. Visualisations are updated automatically to reflect the latest data refresh, so your teams can always work with up-to-date information.
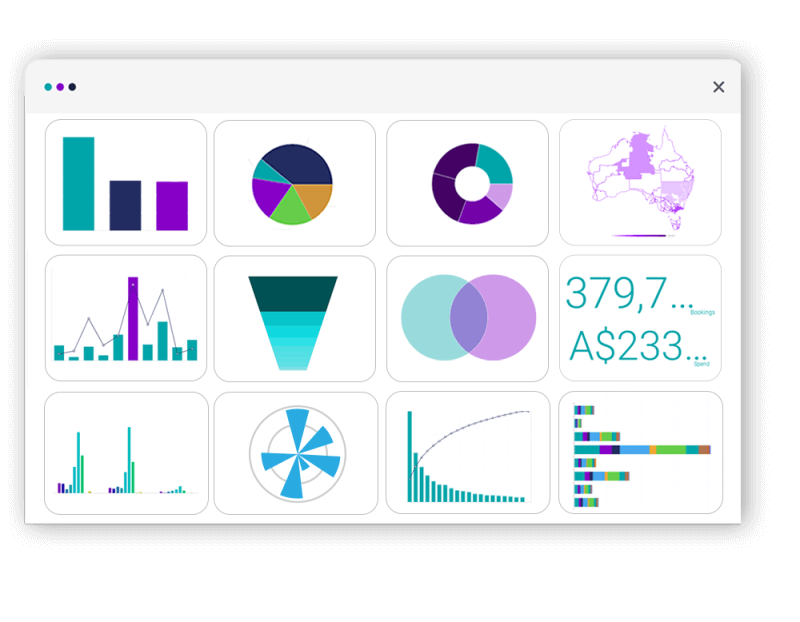
Text and number tiles allow you to add important information to your dashboards
Sometimes a single number is the most important thing you want to track, or you might need to add critical information to describe the other tiles and help viewers understand the information presented. Apteco Orbit's text and number tiles allow you to do just that. Add free text to provide context to the dashboard, to add information about a dashboard, display a single value either as a count or as a calculated aggregation.

Get a clear, concise view of your customer data. Get in touch with the team to learn more about Apteco Orbit dashboards.
Explore other dashboard styles
Action style dashboard
Enables analysis to be run, and a mitigating strategy to be launched from the dashboard.

Analytical style dashboard
In-depth reporting focussing on a specific business function or topic with functionality to explore areas of interest.

Exploratory style dashboard
Advanced data exploration designed by and for advanced users to help evaluate and understand complex data.

Tactical style dashboard
Evaluate and react to results by focussing on a specific business scenario.
