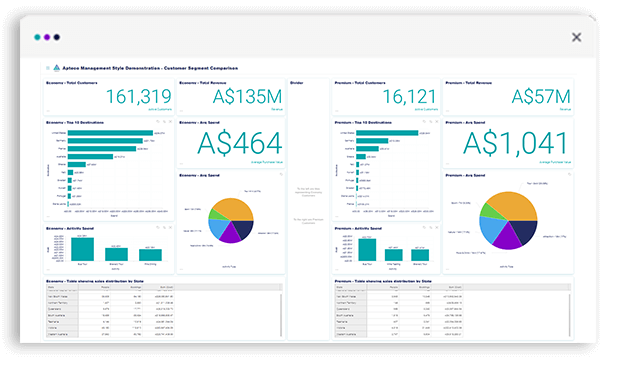
Individuals with specific requirements such as analysts, executives, and operational specialists.
To provide the user with the power to refine and adjust visualisations, identifying the cause of an issue or conversely identifying opportunities.
Evaluate a situation and provide others with the results so that the next course of action can be determined.
Drill-down to gain instant knowledge of different depths of the data
Give your colleagues or clients marketing data dashboards containing summary information and key insights with drill-down interactivity for even greater understanding. Apteco Orbit™ has an clever drill-down feature which allows the user or viewer to explore the data even further by providing more specific, detailed information for a particular tile without overcrowding the dashboard. By simply clicking on the visualisation your clients can view additional levels of data.

Use pie and donut charts to see data comparisons at a glance for immediate analysis
Pie charts and donut charts give your dashboards a concise, neat and clutter-free look. These visualisations provide a strong and immediate sense of overall proportions and permit a quick visual check of the reasonableness or accuracy of calculations. Apteco Orbit pie charts can be filtered or drilled into for even greater insight.

Customise your dashboard design to ensure your brand is always in full view
Put your brand front and centre - upload your logo and create colour themes using your corporate colours to ensure your brand is always recognisable. Apteco Orbit also provides a selection of fonts and beautiful out-of-the-box colour themes for you to choose from.

Get a clear, concise view of your customer data. Get in touch with the team to learn more about Apteco Orbit dashboards.
Explore other dashboard styles
Action style dashboard
Enables analysis to be run, and a mitigating strategy to be launched from the dashboard.

Exploratory style dashboard
Advanced data exploration designed by and for advanced users to help evaluate and understand complex data.


Tactical style dashboard
Evaluate and react to results by focussing on a specific business scenario.


