What’s the ultimate secret to successful data storytelling?
19 Sep 2022 | by Liz Walker
5 min read
How data visualisations can help you tell an engaging story with your data.
When you truly understand your data you can enable decision-making that delivers personalised, entertaining, and highly engaging outcomes. While this is powerful for business success, it’s also a reflection on how we all seek information as human beings.
For example, we tune into our favourite television show to glean insights about our favourite characters. We read a great book to find ourselves immersed in another world or to challenge our understanding of a particular topic, and it makes us feel something – whether positive or negative. The book or the programme, the play or the music is feeding us with information that creates a reaction.
Information is data, and any piece of data can invoke feeling if it’s presented to an audience who considers it relevant. So if all information has value if it’s thought-provoking and relevant, how can marketers ensure they present data that demonstrates its value to a specific audience?
Dashboards helps us tell a story about ourselves – and our customers
As someone who owns a sports watch, I’m very interested in my exercise data. Also, the data of those I consider to be my sports rivals (I tell you this in confidence).
I mean, who knew exercise statistics on dashboards could be so intriguing?
There’s a reason why. Seeing my overall step count this week being compared to last week pushes me to improve.
That dashboard on my sports watch tells me my ‘exercise story’. The story I tell my friends and family about my athletic progress.
On a professional level, however, let’s say that I’m an area manager for a network of stores. I want to understand how my stores are performing, so I need to check whether I’m hitting sales targets and whether I’m on track to meet year-end profit forecasts. I’m also interested in other areas and how my stores are performing against them.
That’s why I use an analytics dashboard that shows me relevant metrics (like store footfall, sales, profit, costs, etc.) and benchmarks my area against other areas. It helps me tell my operations director a story about my overall job performance.
But how can dashboards help you tell an engaging story?
Not every dashboard will help you form a clear and powerful narrative around your data.
Yet doing this has never been more important. In order to get your stakeholders to take action, you need to report data in a way that provokes a reaction.
How?
The trick is to visualise your data carefully.
By this, I don’t mean you should simply label everything correctly (although that’s important too). What you should do is select the type of visualisation that brings your data to life – so whoever you’re reporting to can move past the numbers, and into the realms of understanding and possibility.
Apteco Orbit dashboards contain an extensive kit bag of powerful visualisations.
What types of data visualisation are there?
There are countless ways to effectively visualise the data on your analytics dashboards. Below are a few core examples.
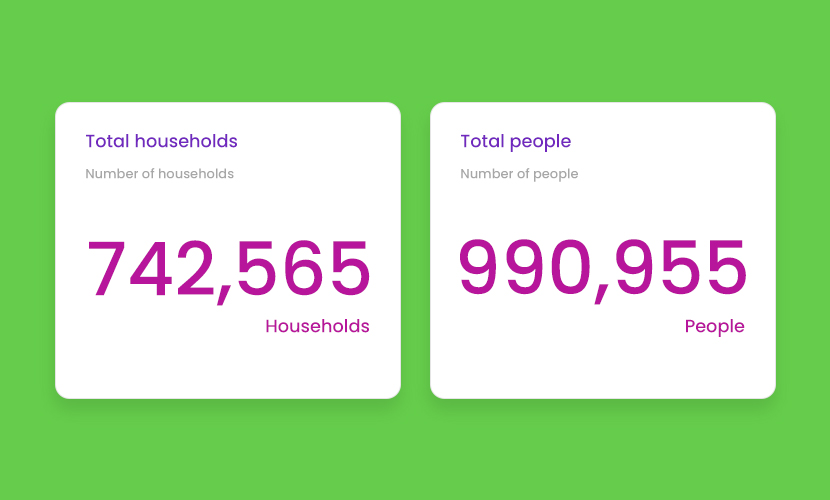
Number and text tiles
Every dashboard needs to include basic information about your customers.
This means you’ll want a couple of headline figures, such as your total number of active customers, their average spend, and your total profit to date.
These can be added to your dashboard via number tiles, which are particularly suited for conveying totals, averages, and maximum and minimum values.
You can make these figures even more meaningful by including numbers from last year, so you can easily gauge whether your organisation is on track.
What’s more, you can also draw attention to key trends, success stories or causes for concern by including text tiles. These allow you, the storyteller, to annotate the dashboard and provide additional context. For example, you may want to explain why your sales may have dipped or skyrocketed.
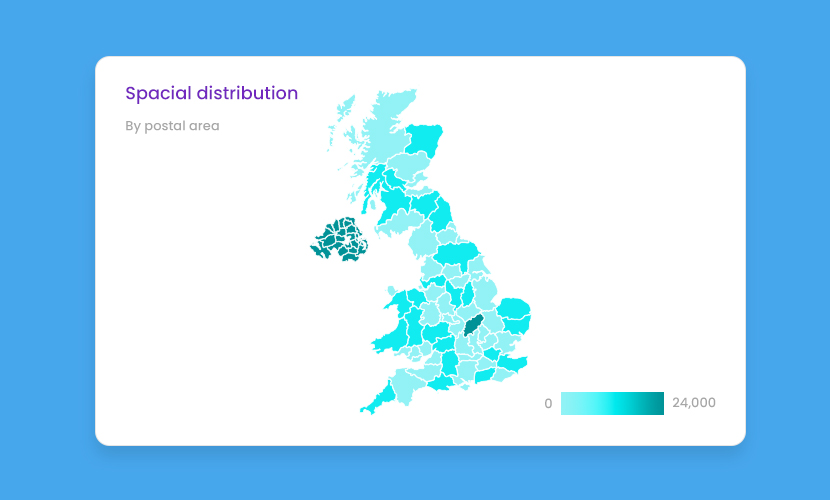
Maps
Maps are best for showing a geographical representation of data. They’re the obvious choice for visualising location-specific questions about your customers. For example:
- What are the top sales regions in X country?
- What does the distribution of customers across X country look like?
From this, you can easily make quick decisions on locations your organisation should target for your local brand awareness or event marketing campaigns.
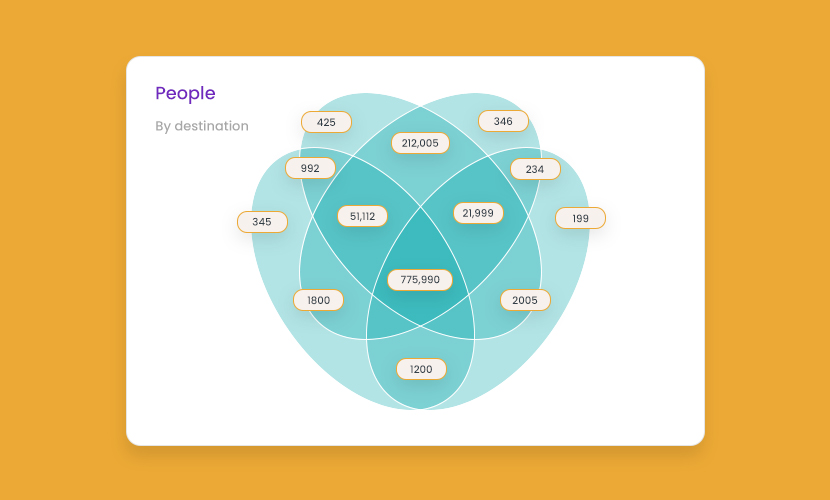
Venn diagrams (my personal favourite)
Think about the times you have to answer these following questions:
- If people buy product A, what else do they buy?
- Are customers aware of our other products?
- Did we over-communicate to our customers this month?
Whenever there’s a question of overlap, a Venn diagram is a great way to visualise your answer.
Apteco Orbit allows you to define groups of customers or transactions (called sets). You can add these sets onto a Venn diagram to see how many customers belong to more than one set.
To offer an example, let’s say you’re working in financial services and need to answer the question: do customers know about your other products and services?
You can start by creating two sets – one for your savings customers, and one for your mortgage customers. Will you be pleasantly surprised that you have customers who use both of your products, or will the diagram reveal no correlation?
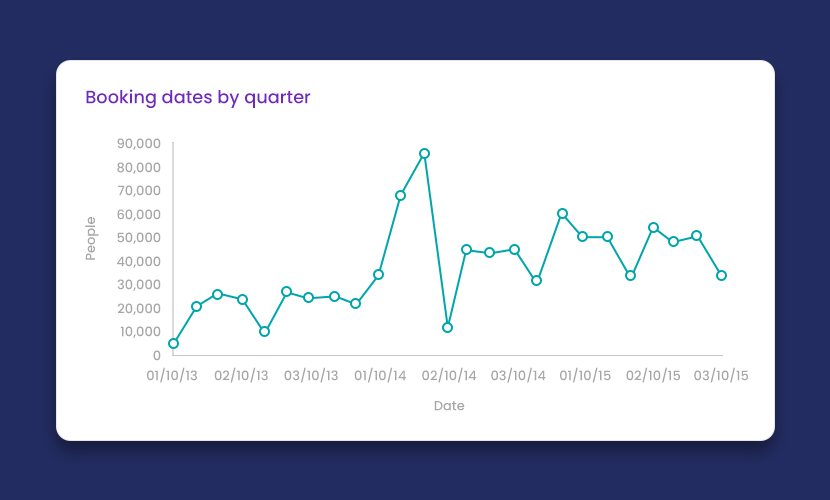
Line charts
Sometimes you’ll wonder whether your current headline figures are simply a fluke or a result of a trend you hadn’t anticipated.
You can avoid this by adding line charts to your dashboard.
Line charts are well-suited for showcasing patterns over time and do an effective job at conveying the peak and troughs. They help you answer most time-based questions related to your data.
For instance, you may hypothesise that your product is transitioning into a seasonal purchase and that your customers like to purchase at specific times of the year. You can confirm or reject your hypothesis by plotting sales over a period of months or quarters to visualise the rise and fall in sales.
With Apteco, you have data visualisation tools at your disposal
There are many other visualisations you can choose to help you build the ‘plot’ of your data story. However, as author and storyteller of the dashboard, you’ll need to take your audience into account when deciding how to tell a story around your data. This way, you’ll gain maximum buy-in and inspire action within your organisation.