The Apteco Datathon: 2. Can Tunisia win the World Cup?
18 Jun 2018 | by Chris Roe
In the second of our Apteco Datathon series we continue to deep dive into real-life datasets to analyse and interpret the numbers. In this blog we will look at whether stats can determine if our blogger’s work sweepstake selection is likely to win this summer’s World Cup – and if not, who will?
Analytic blog posts about the World Cup are very popular at the moment, so here’s my effort. I picked Tunisia as they’re my team in the work sweepstake and I want to see what the chances are of them winning – and therefore of me picking up the prize money.
In this blog post we’ll undertake some general exploratory data analysis and use the Apteco FastStats Segmentation tool to look at teams who have remained unbeaten for significant periods of time with the aim of showing that Tunisia are a better team than their betting odds would suggest.
The Data
The dataset we’ve used for this analysis has come from two different sources, and is more comprehensive than just matches from the football World Cup. We’ve pulled international match result data from Kaggle (1), and domestic football competition data from an R datasets package (2). This domestic competition data comprises matches from several of the European leagues. The data fields provided for each of the leagues and the international matches differ, so we’ve created a FastStats system that has standardised the available variables.
Furthermore, the initial data was structured purely as a set of matches. In the analysis here I’ve been interested in the results of teams so have restructured the data in a team->match format. This has made some analysis much easier, but also had some implications in terms of structuring the data.
The complete system has information on over 1,200 teams and over 330,000 matches.
In this blog post we’ll concentrate on international football results. We may return back to analysing league match data at the start of the next football season!
Exploratory Data Analysis
Only a subset of the above data is going to be used in the following analysis. The relevant data comprises international matches ranging from 1872 to June 1st 2016. During that time, a total of 244 teams have played nearly 78,000 matches. The first international matches were between England and Scotland, and gradually over time other countries started playing matches. Surely we should expect that England have played the most international fixtures? Here’s a cube showing the teams with the most matches.
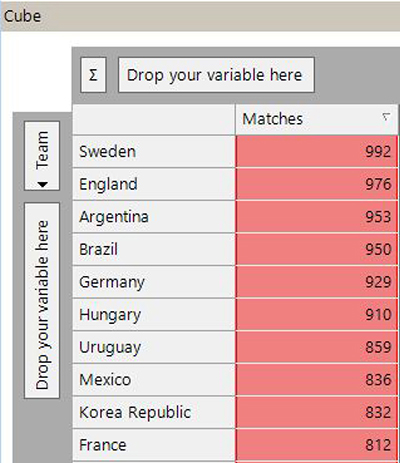
Sweden! That’s not a country I would have guessed to be top of the list. Since their first match in 1908 they’ve been playing on average 9 matches a year with a high of 19 in 1994.
Let’s try something a bit different, and look at how teams actually got on in the matches they played. Here are the top 10 teams ordered by their win percentage.
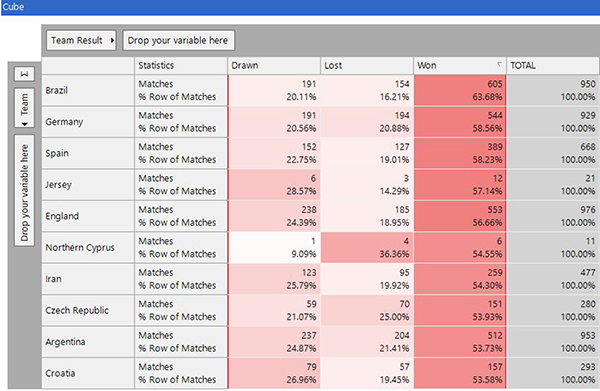
Three footballing powerhouses top the list and there are a number of other good teams too, but there are a couple of surprises in the list:
- Jersey and Northern Cyprus haven’t played many matches, and if explored further we would find that they have been against low standard opposition.
- Iran has a high winning percentage and competed in a significant number of matches.
This seems unusual, so we can drill into just the 477 Iran matches and look at who they have played and how they got on against those teams. Here are the top 10 teams that Iran has played.
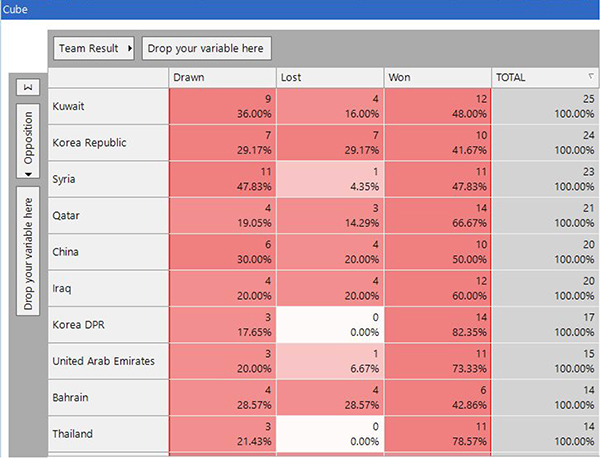
None of these are known as particularly strong teams. This helps explain their good record. Furthermore, there are some teams where their win percentage is significantly below their overall record.
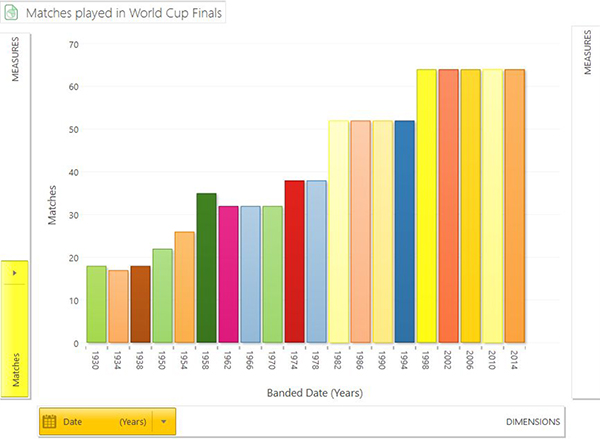
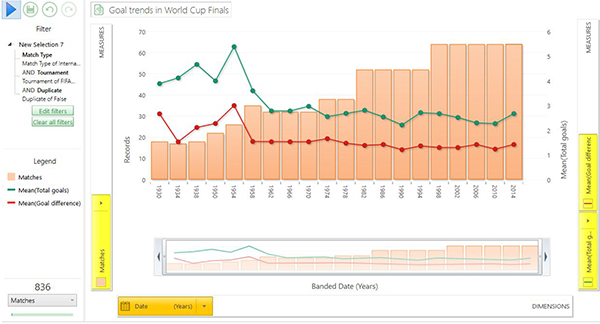
The World Cup has just started, so now I’ll turn my attention to the 836 matches played in the World Cup finals. Firstly, here’s a simple breakdown of the number of matches in each World Cup, showing the expansion of matches in the tournament.
The next chart shows the progression of goal scoring in the World Cup finals. It shows that the goal difference in matches has been reasonably consistent over many World Cup cycles, but the total goals scored have had periods of rise and fall. The last World Cup in 2014 had a significant increase in average goals scored in a match (2.67 compared to 2.27). Will the World Cup 2018 continue this trend and serve up exciting football and lots of goals?
Winning Streaks
We’re now going to consider teams that have been on a roll, and remained unbeaten for a long period of time. Confidence is an important factor in how sports teams perform. When they’re on the biggest stage, having a series of matches behind them in which they haven’t tasted defeat stands them in good stead when it comes to the crunch moments ahead.
In the analysis in this section we’ll use the Segmentation tool to examine winning streaks. I’m considering streaks in terms of time, rather than number of matches. We’ll start by defining whether a team has been unbeaten in the last year as being ‘they have played at least one match in the last year and they have not lost in that time’.
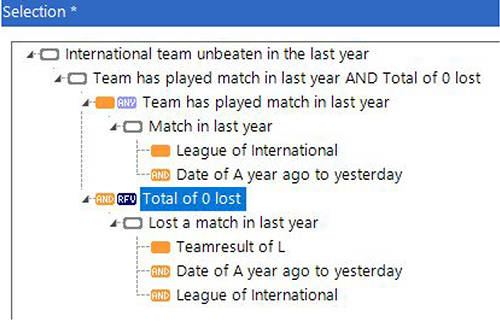
The Segmentation tool allows us to specify a set of time points that we’re interested in reporting on and relating to unbeaten teams. So in the chart below we’ve shown teams that were unbeaten for at least a year on the 1st of June for every year between 2000 and 2018. It would have been easy to extend this back to the 1930s with one simple change to the report.
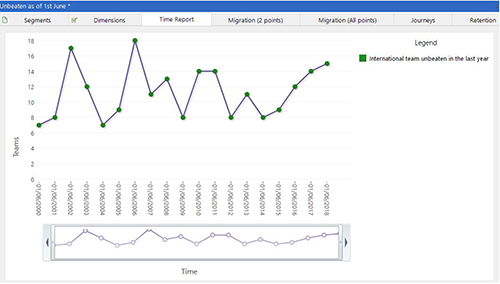
This chart shows that the number has gone up and down over the years, but if we look at the most recent data we can see that there are 15 unbeaten teams as of the 1st June 2018 (3). Looking at those teams in a bit more detail we can find some very good teams, along with some that are unexpected. Here they are, together with the number of matches they’ve played in the last year.
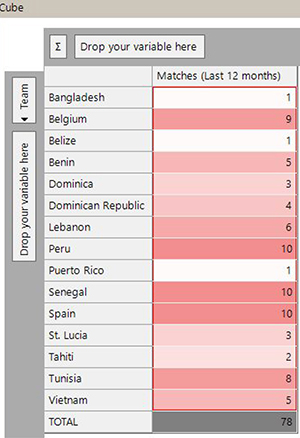
By utilising the Retention report in the Segmentation tool, we can then look at how long these teams have been unbeaten for. The analysis below shows the 15 teams that were unbeaten on 01/06/18. However 5 of them had been in that segment for less than 6 months – meaning that they had lost a game in the 6 months before 01/06/17. A further 8 had been beaten in the 6 months before that, and only 2 teams have currently been unbeaten for at least 2 years.
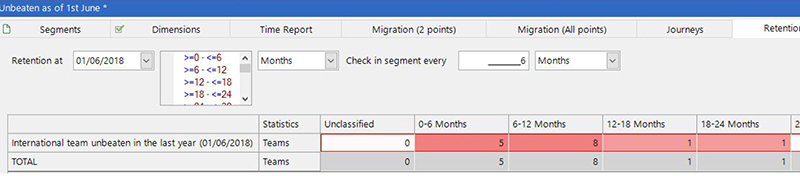
We can drag these cells off the report to find out who they are, and do a quick sanity check to see if the raw data supports the findings from the Retention tool.
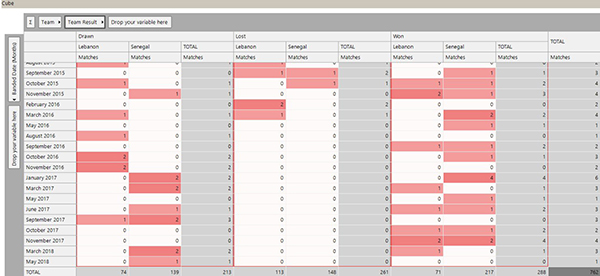
Senegal and Lebanon are the teams – one dark horse bet for the World Cup? And is the other a team on the up?
Clearly this analysis takes no account of the quality of opposition faced. If we were looking to predict teams that are going to do well in Russia then a better bet would be to include this within the analysis. We would then get a better feel for teams who are over-performing and having good results against good quality opposition. A quick scan of our 15 unbeaten teams shows 5 who have qualified for the World Cup (Senegal, Tunisia, Peru, Belgium and Spain).
Returning to the title of the blog post, I drew Tunisia in our World Cup sweepstake and this analysis has given me some faith that they may perform better than I expected!
One final note is that a variation of the above unbeaten streak analysis could be used to try and answer a much trickier set of questions – ‘Which international team had the longest unbeaten streak in terms of time? How long did it last? Who beat them to end the run?’ (4)
Conclusion
I suppose all World Cup blogs should probably try to make at least some predictions on who is going to do well, and I’m going to base mine on the unbeaten streak analysis that I showed earlier. Therefore I’m looking forward to a Belgium v Spain match to decide the winner of the World Cup 2018.
References
(1) International football match data - https://www.kaggle.com/martj42/international-football-results-from-1872-to-2017
(2) R package ‘engsoccerdata’ - https://cran.r-project.org/web/packages/engsoccerdata/index.html
(3) There have been some changes to these unbeaten records in the pre-World Cup friendly matches played in the last few days. For example, both Senegal and Tunisia have lost matches so their unbeaten runs have ended just before the start of the World Cup.
(4) The same restriction applies here that the team must not have had a gap of more than 1 year between two fixtures. Good quiz question this one! What would life be like if there wasn’t a challenge? Can you find out the answer? The first correct answer sent to me by email will win a prize!
See how successful marketers are enjoying winning streaks by downloading the Customer Centric Data Trends 2018.